|
|
Climate Plots
@climate-plots.bsky.social
[ View ] |
The Southern Oscillation index describes El Niño and La Niña events
0 replies 0 reposts 0 likes
|
Climate Plots@climate-plots.bsky.social |
22 followers 1 following 50 posts
Automatically updated plots about our climate.
climate-plots.github.io
|
|
Climate Plots
@climate-plots.bsky.social
[ View ] |
The Southern Oscillation index describes El Niño and La Niña events
0 replies 0 reposts 0 likes
|
|
Climate Plots
@climate-plots.bsky.social
[ View ] |
Global average sea surface temperature, monthly
0 replies 0 reposts 0 likes
|
|
Climate Plots
@climate-plots.bsky.social
[ View ] |
Arctic sea ice extent, by year
0 replies 0 reposts 0 likes
|
|
Climate Plots
@climate-plots.bsky.social
[ View ] |
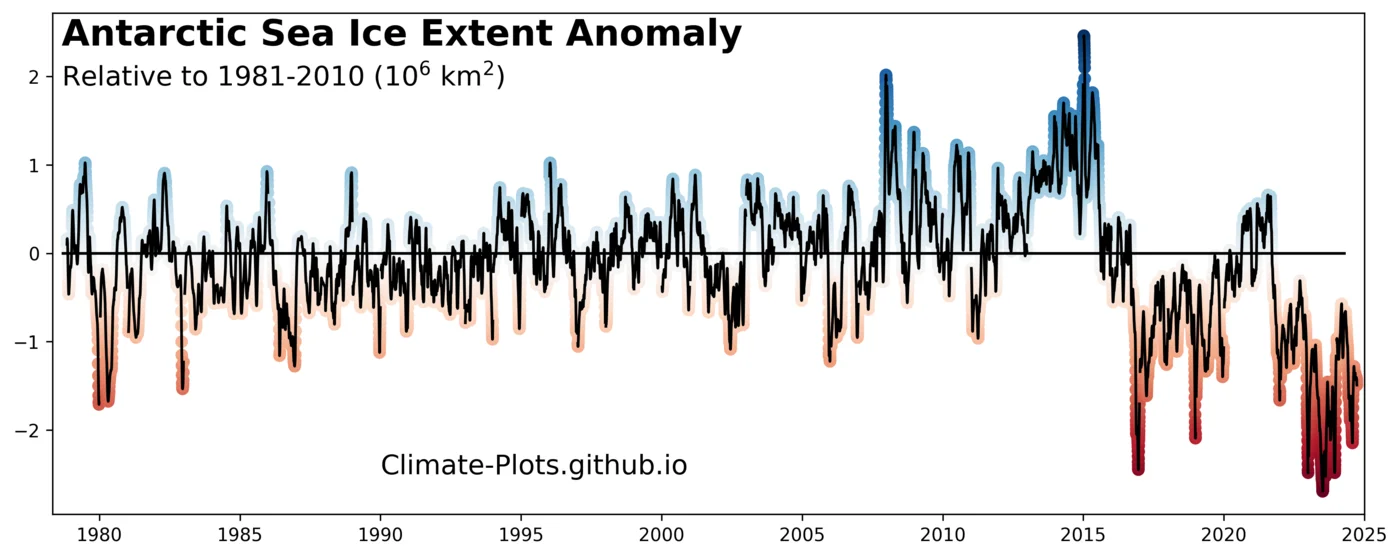
Antarctic sea ice extent anomaly
0 replies 1 reposts 1 likes
|
|
Climate Plots
@climate-plots.bsky.social
[ View ] |
Arctic sea ice extent climatology
0 replies 0 reposts 0 likes
|
|
Climate Plots
@climate-plots.bsky.social
[ View ] |
The Atlantic Multidecadal Oscillation
0 replies 0 reposts 0 likes
|
|
Climate Plots
@climate-plots.bsky.social
[ View ] |
The Atlantic Multidecadal Oscillation
0 replies 0 reposts 0 likes
|
|
Climate Plots
@climate-plots.bsky.social
[ View ] |
The Atlantic Multidecadal Oscillation
0 replies 0 reposts 0 likes
|
|
Climate Plots
@climate-plots.bsky.social
[ View ] |
Antarctic sea ice extent anomalies converted to standard deviations, by year
0 replies 0 reposts 1 likes
|
|
Climate Plots
@climate-plots.bsky.social
[ View ] |
Antarctic sea ice extent anomalies converted to standard deviations, by year
0 replies 0 reposts 0 likes
|
|
Climate Plots
@climate-plots.bsky.social
[ View ] |
Arctic sea ice extent anomaly
0 replies 0 reposts 0 likes
|
|
Climate Plots
@climate-plots.bsky.social
[ View ] |
Anomalonimius is now living rent free in my head. 🫠
0 replies 0 reposts 1 likes
|
|
Climate Plots
@climate-plots.bsky.social
[ View ] |
Antarctic sea ice extent anomaly
1 replies 1 reposts 2 likes
|
|
Climate Plots
@climate-plots.bsky.social
[ View ] |
Arctic sea ice extent anomalies, by year
0 replies 0 reposts 0 likes
|
|
Climate Plots
@climate-plots.bsky.social
[ View ] |
Arctic sea ice extent anomaly
0 replies 0 reposts 0 likes
|
|
Climate Plots
@climate-plots.bsky.social
[ View ] |
Global average sea surface temperature, monthly
0 replies 0 reposts 0 likes
|
|
Climate Plots
@climate-plots.bsky.social
[ View ] |
Antarctic sea ice extent climatology
0 replies 0 reposts 0 likes
|
|
Climate Plots
@climate-plots.bsky.social
[ View ] |
2023 - last year was bonkers.
0 replies 0 reposts 1 likes
|
|
Climate Plots
@climate-plots.bsky.social
[ View ] |
Arctic sea ice extent anomalies converted to standard deviations, by year
0 replies 0 reposts 0 likes
|
|
Climate Plots
@climate-plots.bsky.social
[ View ] |
Antarctic sea ice extent anomalies converted to standard deviations, by year
1 replies 4 reposts 7 likes
|
|
Climate Plots
@climate-plots.bsky.social
[ View ] |
Antarctic sea ice extent, by year
0 replies 0 reposts 2 likes
|
|
Climate Plots
@climate-plots.bsky.social
[ View ] |
Global average sea surface temperature, monthly
0 replies 0 reposts 1 likes
|
|
Climate Plots
@climate-plots.bsky.social
[ View ] |
The Southern Oscillation index describes El Niño and La Niña events
0 replies 0 reposts 0 likes
|
|
Climate Plots
@climate-plots.bsky.social
[ View ] |
Arctic sea ice extent anomaly
0 replies 0 reposts 1 likes
|
|
Climate Plots
@climate-plots.bsky.social
[ View ] |
Antarctic sea ice extent anomalies converted to standard deviations, by year
0 replies 0 reposts 1 likes
|
|
Climate Plots
@climate-plots.bsky.social
[ View ] |
Arctic sea ice extent climatology
0 replies 0 reposts 1 likes
|
|
Climate Plots
@climate-plots.bsky.social
[ View ] |
The Southern Oscillation index describes El Niño and La Niña events
0 replies 0 reposts 0 likes
|
|
Climate Plots
@climate-plots.bsky.social
[ View ] |
That’s a great idea! Shouldn’t be too hard to implement. (Also, FYI you can find the code to create all the plots in GitHub, the link is on the homepage in the bio.)
0 replies 0 reposts 1 likes
|
|
Climate Plots
@climate-plots.bsky.social
[ View ] |
The Southern Oscillation index describes El Niño and La Niña events
0 replies 0 reposts 0 likes
|
|
Climate Plots
@climate-plots.bsky.social
[ View ] |
Global average sea surface temperature, monthly
1 replies 0 reposts 0 likes
|
|
Climate Plots
@climate-plots.bsky.social
[ View ] |
Antarctic sea ice extent anomalies converted to standard deviations, by year
0 replies 1 reposts 1 likes
|
|
Climate Plots
@climate-plots.bsky.social
[ View ] |
Arctic sea ice extent, by year
0 replies 0 reposts 0 likes
|
|
Climate Plots
@climate-plots.bsky.social
[ View ] |
The Southern Annular Mode, annual average
0 replies 0 reposts 0 likes
|
|
Climate Plots
@climate-plots.bsky.social
[ View ] |
Antarctic sea ice extent climatology
0 replies 0 reposts 0 likes
|
|
Climate Plots
@climate-plots.bsky.social
[ View ] |
Global average sea surface temperature
0 replies 0 reposts 0 likes
|
|
Climate Plots
@climate-plots.bsky.social
[ View ] |
Antarctic sea ice extent anomaly
0 replies 1 reposts 2 likes
|
|
Climate Plots
@climate-plots.bsky.social
[ View ] |
Global average sea surface temperature
0 replies 0 reposts 0 likes
|
|
Climate Plots
@climate-plots.bsky.social
[ View ] |
Antarctic sea ice extent anomalies, by year
0 replies 0 reposts 0 likes
|
|
Climate Plots
@climate-plots.bsky.social
[ View ] |
The Atlantic Multidecadal Oscillation
0 replies 0 reposts 0 likes
|
|
Climate Plots
@climate-plots.bsky.social
[ View ] |
The Southern Annular Mode, annual average
0 replies 0 reposts 0 likes
|
|
Climate Plots
@climate-plots.bsky.social
[ View ] |
The Interdecadal Pacific Oscillation
0 replies 0 reposts 0 likes
|
|
Climate Plots
@climate-plots.bsky.social
[ View ] |
Antarctic sea ice extent anomalies, by year
0 replies 0 reposts 0 likes
|
|
Climate Plots
@climate-plots.bsky.social
[ View ] |
Antarctic sea ice extent anomalies, by year
0 replies 0 reposts 0 likes
|
|
Climate Plots
@climate-plots.bsky.social
[ View ] |
Second lowest on record for this day of the year and dropping fast 😬
climate-plots.github.io/projects/Ant...
0 replies 1 reposts 0 likes
|
|
Climate Plots
@climate-plots.bsky.social
[ View ] |
Antarctic sea ice test
climate-plots.github.io/assets/img/A...
0 replies 0 reposts 1 likes
|
|
Climate Plots
@climate-plots.bsky.social
[ View ] |
The Atlantic Multidecadal Oscillation shows long-duration changes in the surface temperature of the North Atlantic Ocean.
climate-plots.github.io/projects/AMO/
0 replies 0 reposts 0 likes
|
|
Climate Plots
@climate-plots.bsky.social
[ View ] |
The Southern Annular Mode describes the strength and position of the roaring forties.
climate-plots.github.io/projects/SAM/
0 replies 0 reposts 0 likes
|
|
Climate Plots
@climate-plots.bsky.social
[ View ] |
Antarctic sea ice is well above last year, but still very low.
What's going to happen in the next month - will it keep trending down like 2023 did?
climate-plots.github.io/projects/Ant...
0 replies 1 reposts 0 likes
|
|
Climate Plots
@climate-plots.bsky.social
[ View ] |
Are there other plots you'd like to see? Suggest them!
0 replies 0 reposts 0 likes
|
|
Climate Plots
@climate-plots.bsky.social
[ View ] |
Hello world!
Do you want a daily dose of climate data in your life? Then follow along as I post one graph each day.
climate-plots.github.io
1 replies 0 reposts 3 likes